View Demos:
These examples are based on the original FLOT examples but I changed a thing or two just to highlight the problem I was trying to solve.And to make the examples more interesting, in all of them I'm also using the canvas2image library, created by Jacob Seidelin in order to show you how easy it is to put the canvas data into an image... Sorry IE Users, that button might be disabled for you.
Example 1
Example 2
Example 3
Example 4
Example 5
flotCanvasText Plugin
Open Source • 2010-2012
A canvas-based Text Plugin for Flot, the JavaScript plotting library for jQuery
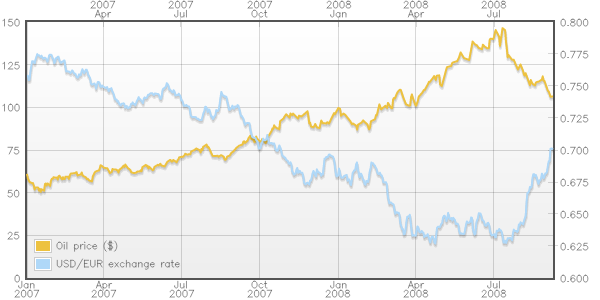
This project is a simple Flot plugin that "draws" text (tick labels, data point values, legends, etc...) directly on FLOT's canvas context.
FLOT itself is an amazing graph package written on top of JQuery.
To download the plugin, visit my github page.
Why would someone need this?
The Reasoning: Back at the time of release 0.6, FLOT's tick labels and the legends were all created using HTML DIVs (i.e. they were not created directly on the Canvas object).As a consequence, you couldn't use the canvasInstance.toDataURL("image/png") method to export the complete graph (lines+text) as an image.
The reason I wrote this was because I needed to completely remove all the DIV overlays from the graph. That's why this plugin was created.